Image copyright
Copernicus Data/Esa/Airbus/M.Pourshamsi

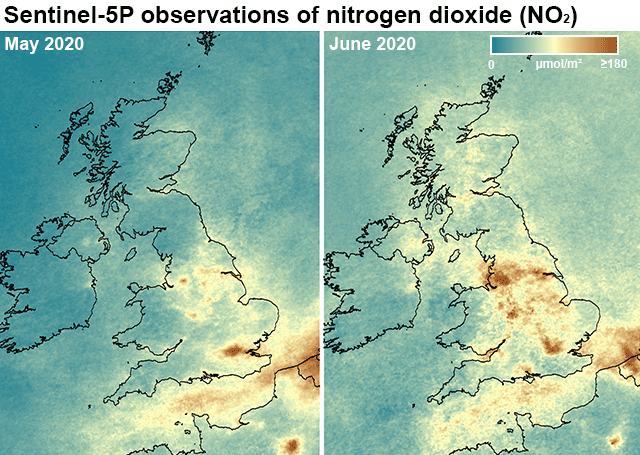
Some of the dirty air associated with vehicles seems to be creeping up again as the UK eases itself out of lockdown.
The latest data acquired by the EU’s Sentinel-5P spacecraft, which was built in the UK, suggests levels of nitrogen dioxide are rising in the big cities.
Comparing locked-down May with June, when restrictions were being lifted, certainly hints at this change.
NO2 is a byproduct from the burning of fuels such as petrol and diesel and is a respiratory irritant.
- Europe and US line up to measure Antarctic sea-ice
- UK takes £400m stake in satellite firm OneWeb
- UK industry loses out in European satellite bids
The maps on this page contrast May 2019 with May 2020, which points to a 20-50% reduction year on year in concentrations; and May 2020 with June 2020, which illustrates a jump in NO2 around the major urban centres like London and Manchester.
The analyses were produced by Dr Maryam Pourshamsi, an Earth observation specialist with Airbus.
She cautions though that although S5P data is available daily, to get reliable results the satellite’s measurements must be averaged for at least 10 days.
This removes some of observed day-to-day variability – a factor that is heavily influenced by weather conditions. A lot of cloud, for example, will obscure S5P’s vision.
“When I analysed the data, April looked much less stable than May because in May we had more sunny days and not quite as much wind,” she explained.
“June too has become cloudy and windy again – so although the map indicates a jump in NO2 concentration, we should probably wait until the July and August analyses for a more reliable result,” she told BBC News.
Image copyright
Copernicus Data/Esa/Airbus/M.Pourshamsi
The Tropomi instrument on S5P is sensitive to a range of trace gases and small particles/droplets in the atmosphere, in addition to NO2. These other targets include ozone, formaldehyde, sulphur dioxide, methane, and carbon monoxide.
Tropomi has a resolution of 7km by 3km, allowing it to capture a broad picture of what’s going on. Individual road-side monitors in the government’s Automatic Urban and Rural Network (AURN) will detail the story at the kerbside.
Prof Paul Palmer, from Edinburgh University, is a frequent user of AURN.
“I’ve taken a look at some sites across the UK (London Marylebone, Cambridge, Manchester and Bristol) and there are signs that NO2 is beginning to creep slowly back to levels that we expect for this time of year, but there is still some way to go.
“The speed of this NO2 rebound is certainly not uniform across cities. That’s more or less in line with the Google mobility data,” he told BBC News.
Google uses anonymised location data from people’s mobile phones to track trends in movement.
NO2 is not the only air quality indicator. Ozone was seen to climb during lockdown – that’s because some the chemistry that surpasses it is tied up with NO2 emissions.
Particulate matter (PM2.5) also rose. There isn’t really a consensus on why this happened but some of the explanation may be found in wind behaviour that blew this particular pollution in from the continent.
The UK as a whole went into lockdown on 23 March, with people urged to stay at home other than for essential work, shopping and exercise. The individual home nations then began to relax restrictions part way through May and at the beginning of June.
Sentinel-5P is part of the EU’s Copernicus network. Its Tropomi instrument is a Dutch initiative led from the Royal Netherlands Meteorological Institute. The sensor was integrated into the spacecraft at Airbus in Stevenage and launched in 2017.
Although the UK is no longer in the EU, it is seeking continued membership of Copernicus as a “third country” through the current London-Brussels trade negotiations.
Image copyright
ESA
[email protected] and follow me on Twitter: @BBCAmos
Read MoreFeedzy